Construction Revenue Forecasting: the construction cash flow quick-start guide
5 steps for general contractors to forecast revenue
November 23, 2021
4 min read
Learnables

Michael Sullivan
Senior Growth Marketer

Construction Revenue Forecasting: the construction cash flow quick-start guide
Revenue forecasting is important for businesses in all industries. But general contractors, it is absolutely crucial and required to run a successful company. Forecasting revenue properly allows general contractors to accurately predict cash flow, gaps in revenue, and the ability to manage their workforce. If done early enough, a general contractor can work with their business development team to fill revenue gaps with projects.
Level up your business development with Buildr - the Construction CRM
When construction revenue forecasting is done wrong:
Gaps in revenue gaps will go unnoticed and profitability will decline
Project team members will have no active job and cause profitability to decline
You take on too many jobs and project teams over extend themselves by juggling multiple jobs at the same time
Your competitors win jobs that you could have pursued
When construction revenue forecasting is done right:
Maximize efficiency of project teams
Increase company profitability
Improve cash flow management
Prevent gaps in revenue
Increase visibility of all committed and project pursuit pipeline
Use data to decide how to grow your annual construction volume
Revenue forecasting basics for general contractors in 5 steps
Get organized with your project pursuit data
Record the necessary fields to use for forecasting
Calculate revenue forecasts for a single project
Combine the revenue forecast from all projects
Visualize and act on the data
1. Get organized with your project pursuit data
The first step in forecasting data starts with organizing your pursuit data. This means getting all active projects, backlogged projects, and pursuit data in the same place. For some companies, they are already using a CRM. Others might be using a shared spreadsheet. And for some unfortunate companies they have data that is all over the place (including inside your business development team's heads) and in complete disarray.
Without up-to-date project data, your revenue forecast will not be reliable or accurate so this should be your #1 priority. The benefits of a CRM go far beyond revenue forecasting (better follow-up, collaboration, business development analytics - the list goes on), but that is a topic for another time.
Summary: get your project data in one place and keep it up to date.
2. Record the necessary project information
Now that you have your project data in one place, the next step is to record the data that we need from each project in order to forecast revenue.
The required fields are the following:
Project Start Date
Project End Date
Total Project Value
Stage (is this project a pursuit or has it been awarded?)
When a project is still a pursuit, the dates and values are still changing. That’s okay - just get as close as you can and make sure you keep these fields updated when you gather new information (did I mention a CRM makes this easy?).
Once you have these fields on your projects, you are ready to calculate the revenue forecast for individual projects.
3. Calculate the revenue forecast of an individual project
Now let’s start small by calculating the revenue forecast for a single project. This guide will explain how to do this with a spreadsheet - if you are using a CRM you may need to export your project data into a CSV and import it into a spreadsheet tool. It may also have built-in functionality to help with your forecast (like Buildr), or might integrate into another tool that does (such as PowerBI).
To do this, we will break down the revenue of each month that the project is active. If you are using a spreadsheet, it will look something like this:
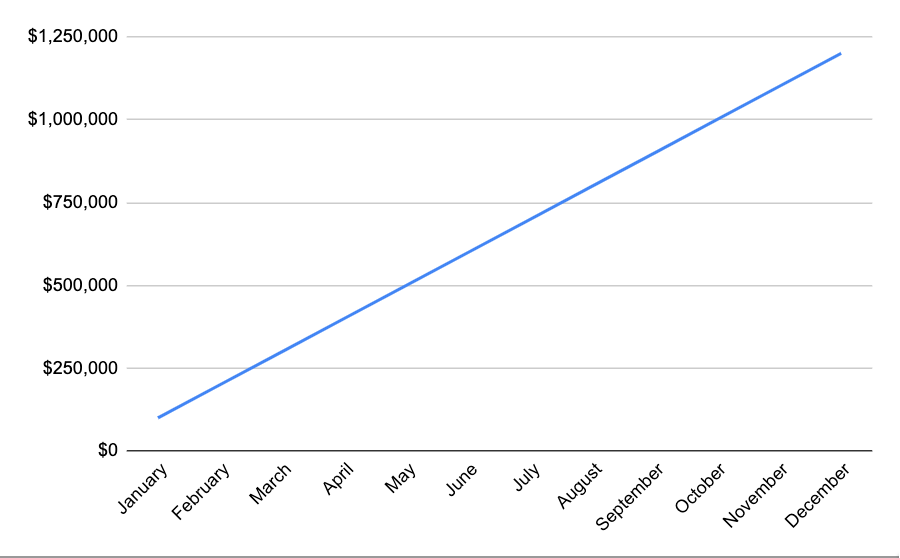
Project value: $1,200,000
Project Duration: 12 months

Note: Be sure to check if a given month is between the project start and end date.
This example will attribute an equal amount of revenue for each month the project is active. This means that if we graph the cumulative project revenue over time it would be a straight line:

Now that we have this setup for one project, we can add more projects and see how the forecast looks.
Getting more advanced with forecast calculations
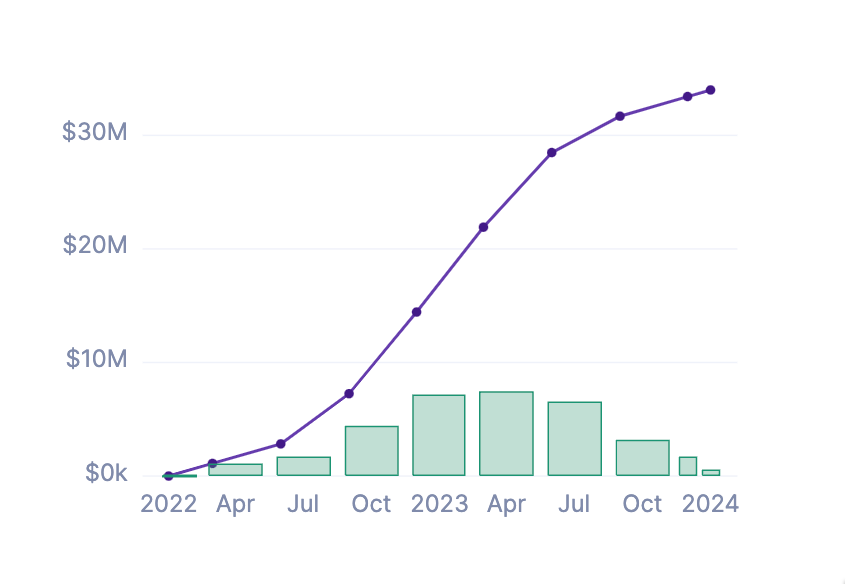
While an even monthly distribution is straightforward to setup, construction projects do not bring in equal amounts of revenue each month. This is because revenue is tied directly to project progress, and the middle of a construction project typically has the most progress.
This would result in an s-curve instead of the straight line:

To keep this guide simple, we will continue use the straight line / equal distribution method. Know that if you were to add functionality to this system, you could apply an s-curve formula instead (or get a construction CRM that does the complex calculations for you)
4. Combine the revenue forecast from all projects
Next, let’s add more projects to our system and start looking at the total forecasted revenue.
In this example, we will just add some project rows:

You will now also notice a new row to represent the total revenue (sum of each project’s monthly revenue) at the bottom.
You should start to notice trends with expected revenue, which we will visualize in the next step.
5. Visualize and act on the forecast data
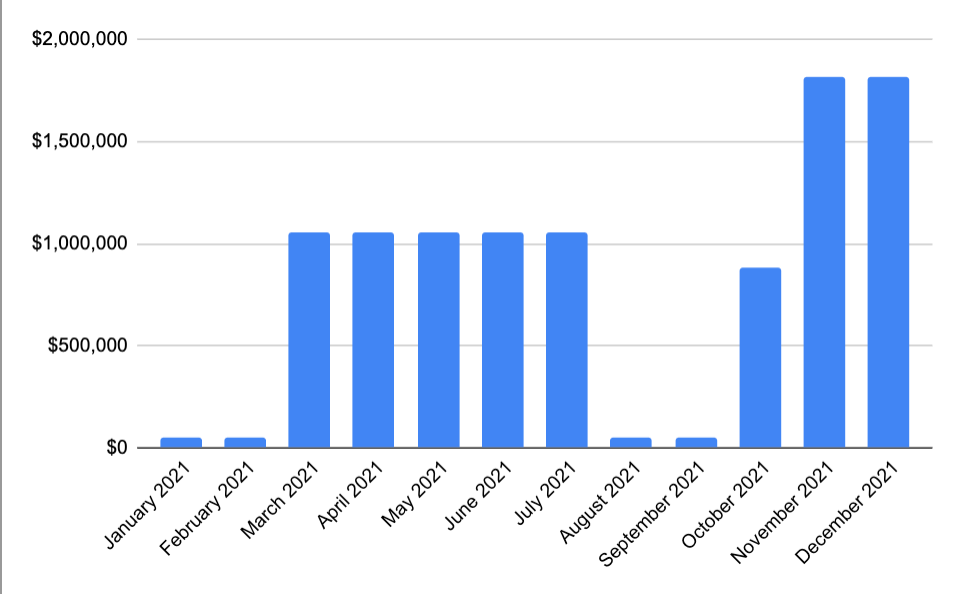
To get this data into an easily understandable format, we can use a simple bar chart:

This lets us easily identify trends in the pipeline. In our example, we can now see we have a few gaps in our pipeline! Let’s make sure we focus our business development team on filling those gaps.
What’s next?
This is just a jump off point to get you started with construction revenue forecasting. There are countless ways you can improve on this method and add additional functionality:
Add stage to projects (awarded, backlog, pursuit) so you can see what your pipeline is comprised of. A stacked bar chart is a great way to visualize this!
Expand the date range you are looking at. Most general contractors want to see multi-year lookahead
Tie this to your workforce planning system - do you have enough project team members to fill your awarded jobs or pursuits?
What types of jobs make up your pipeline? Are you hyper focused on a few industries (data centers, apartment complexes, custom homes, car dealerships)? Should you diversify, or invest more in certain types of projects?
Use win probability percentage to get a rough approximation of your future pipeline
The most important thing is you use this data to make more informed decisions. Start small and build on it!
Looking for a system that has revenue forecasting out of the box? Buildr has you covered and more!
Easy-to-use system that provides you value quickly
Filter and manipulate the data to run scenarios
Built in s-curve revenue forecasting
Charts and graphs to visualize your pipeline
Reports to better understand your data
Combine revenue forecasting and workforce management
Get your entire team on the same system that keeps your project and client data up to date
Stay in the loop
Seriously, you should sign up to be a construction insider. Everyone will be so jealous of you.